Data Viz
I recently completed a Masters at MICA studying data visualization and information design. These are some projects I’ve made for class, as well as some personal projects.

Sock Knitting Myths
In an age of fast fashion a pair of hand-knit socks is a luxury. So why do knitters fear socks? I analyzed over 50,000 sock patterns to debunk sock knitting myths.
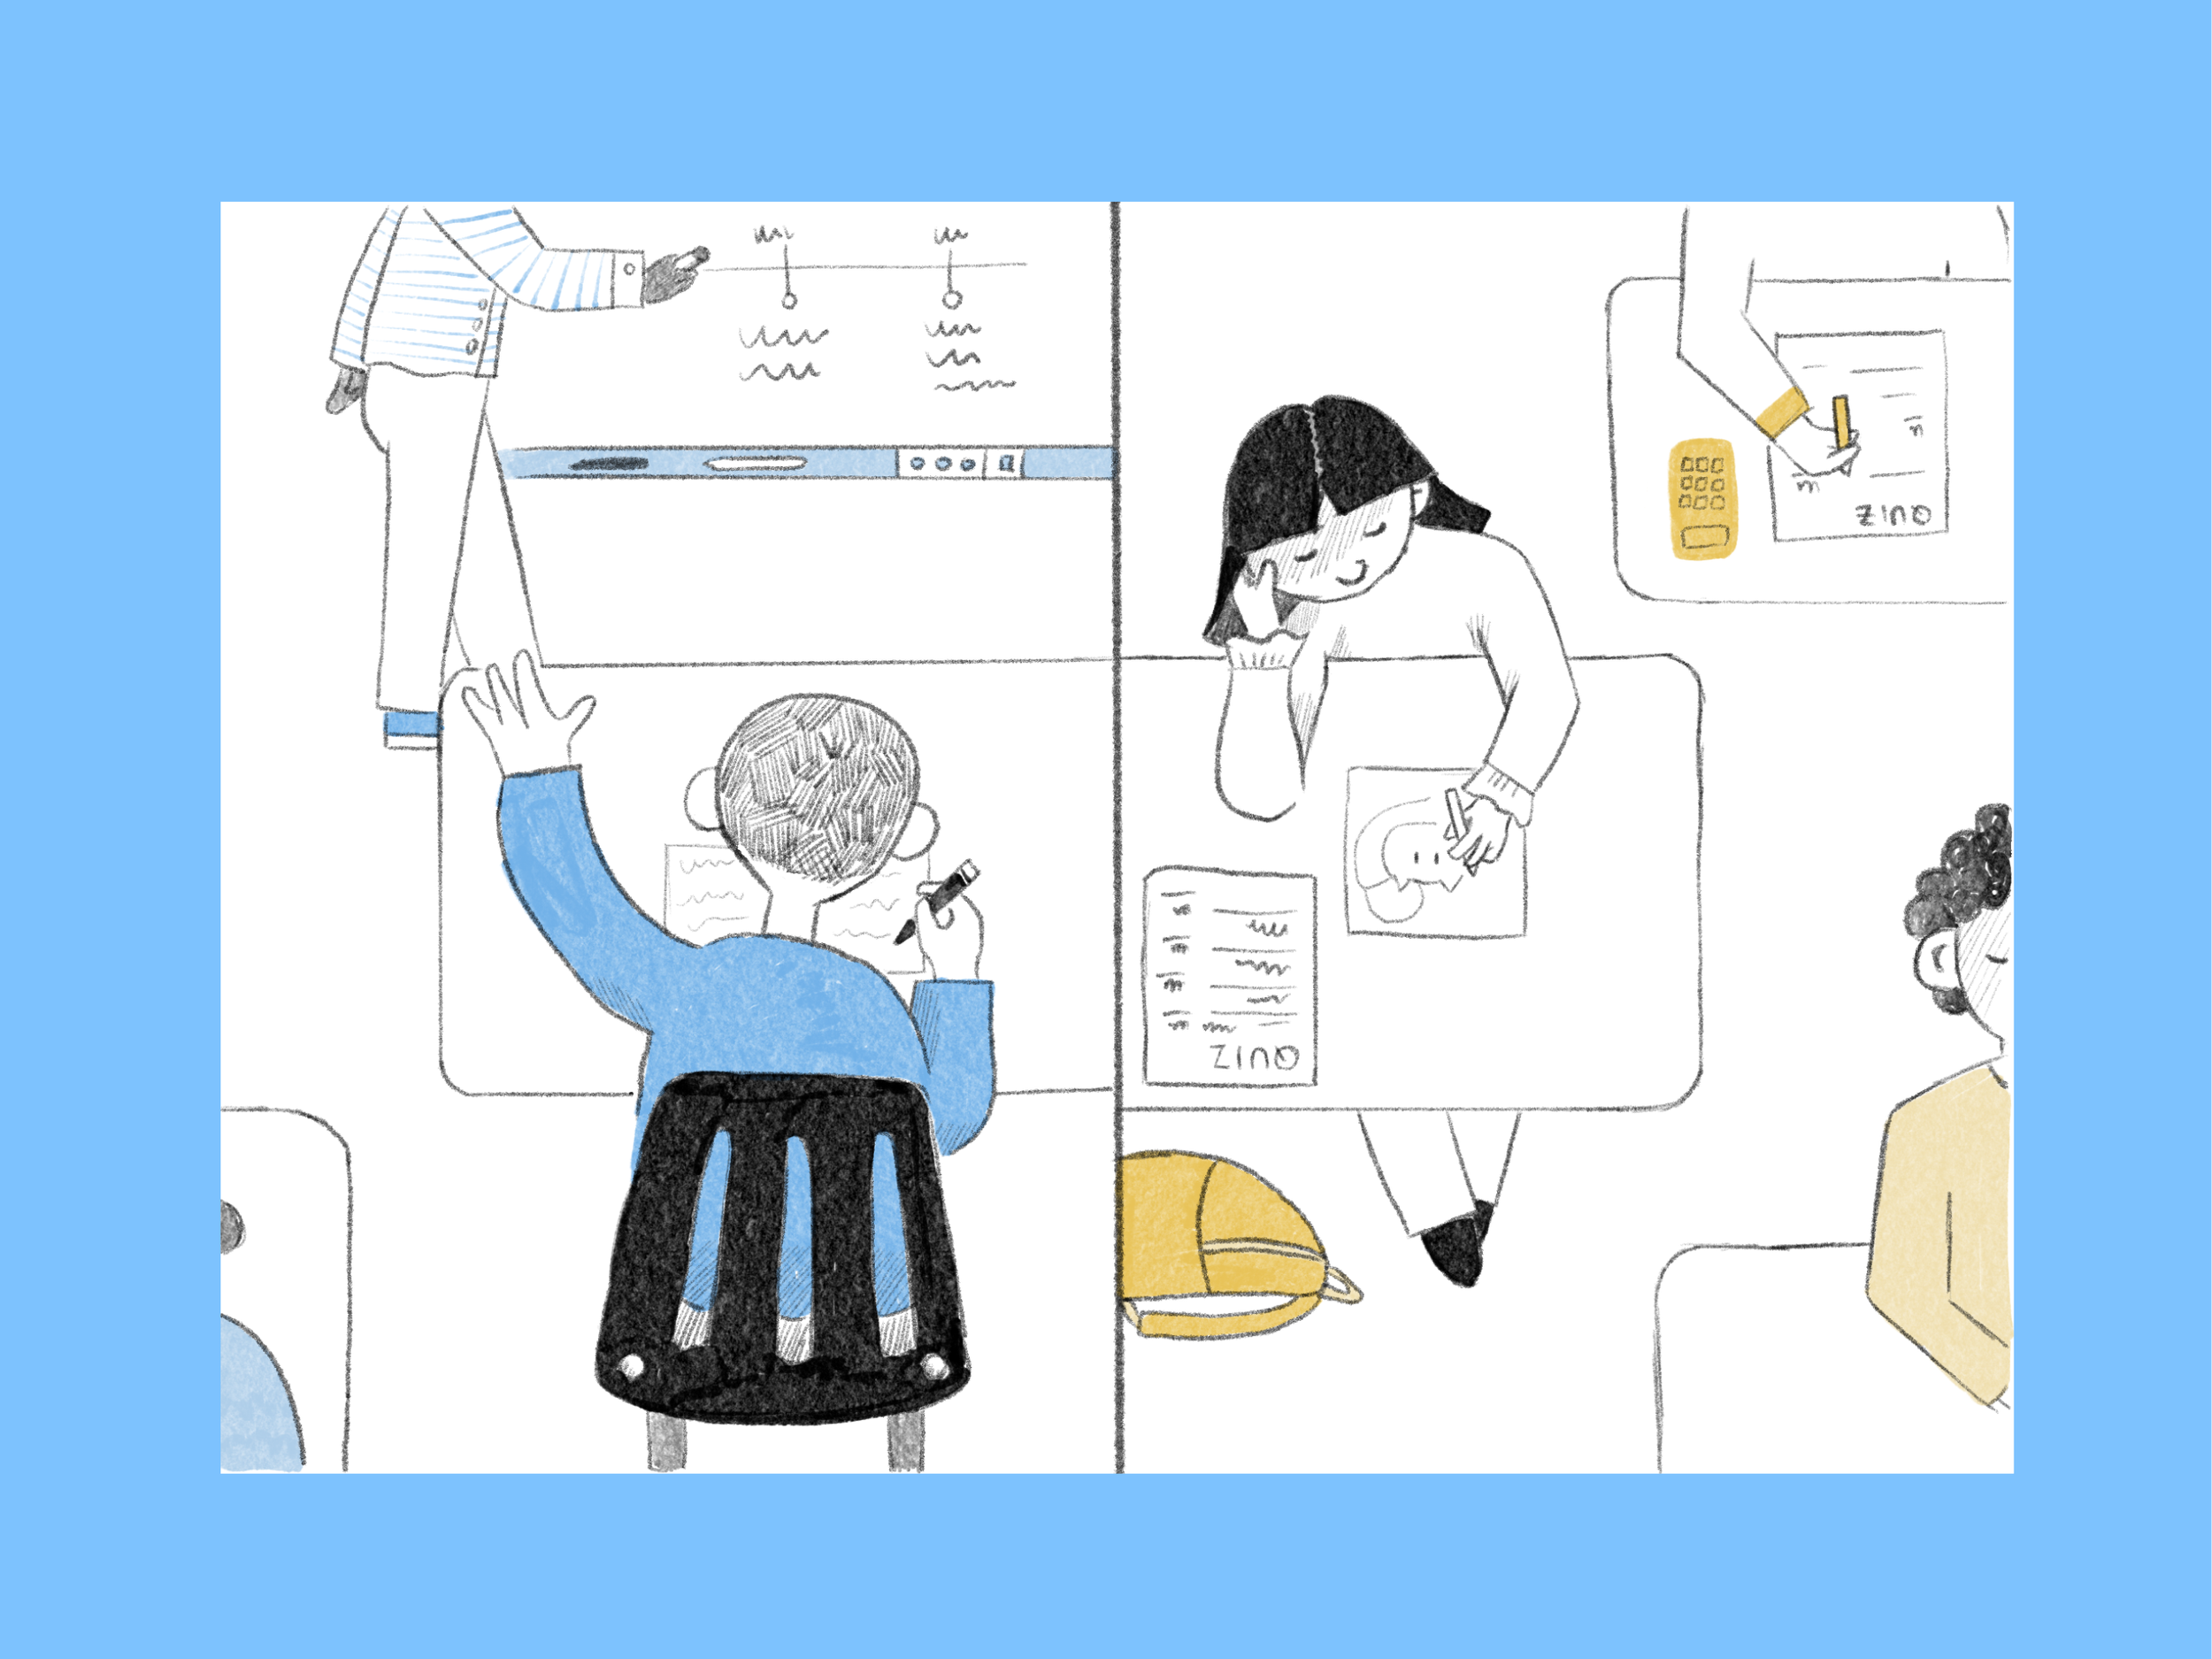
Our schools are still segregated
A scrollytelling story about school segregation. Illustrations hand-drawn by me and charts created using Datawrapper.

A Book Quilt
A small quilt made with data from all the books I read in 2023.
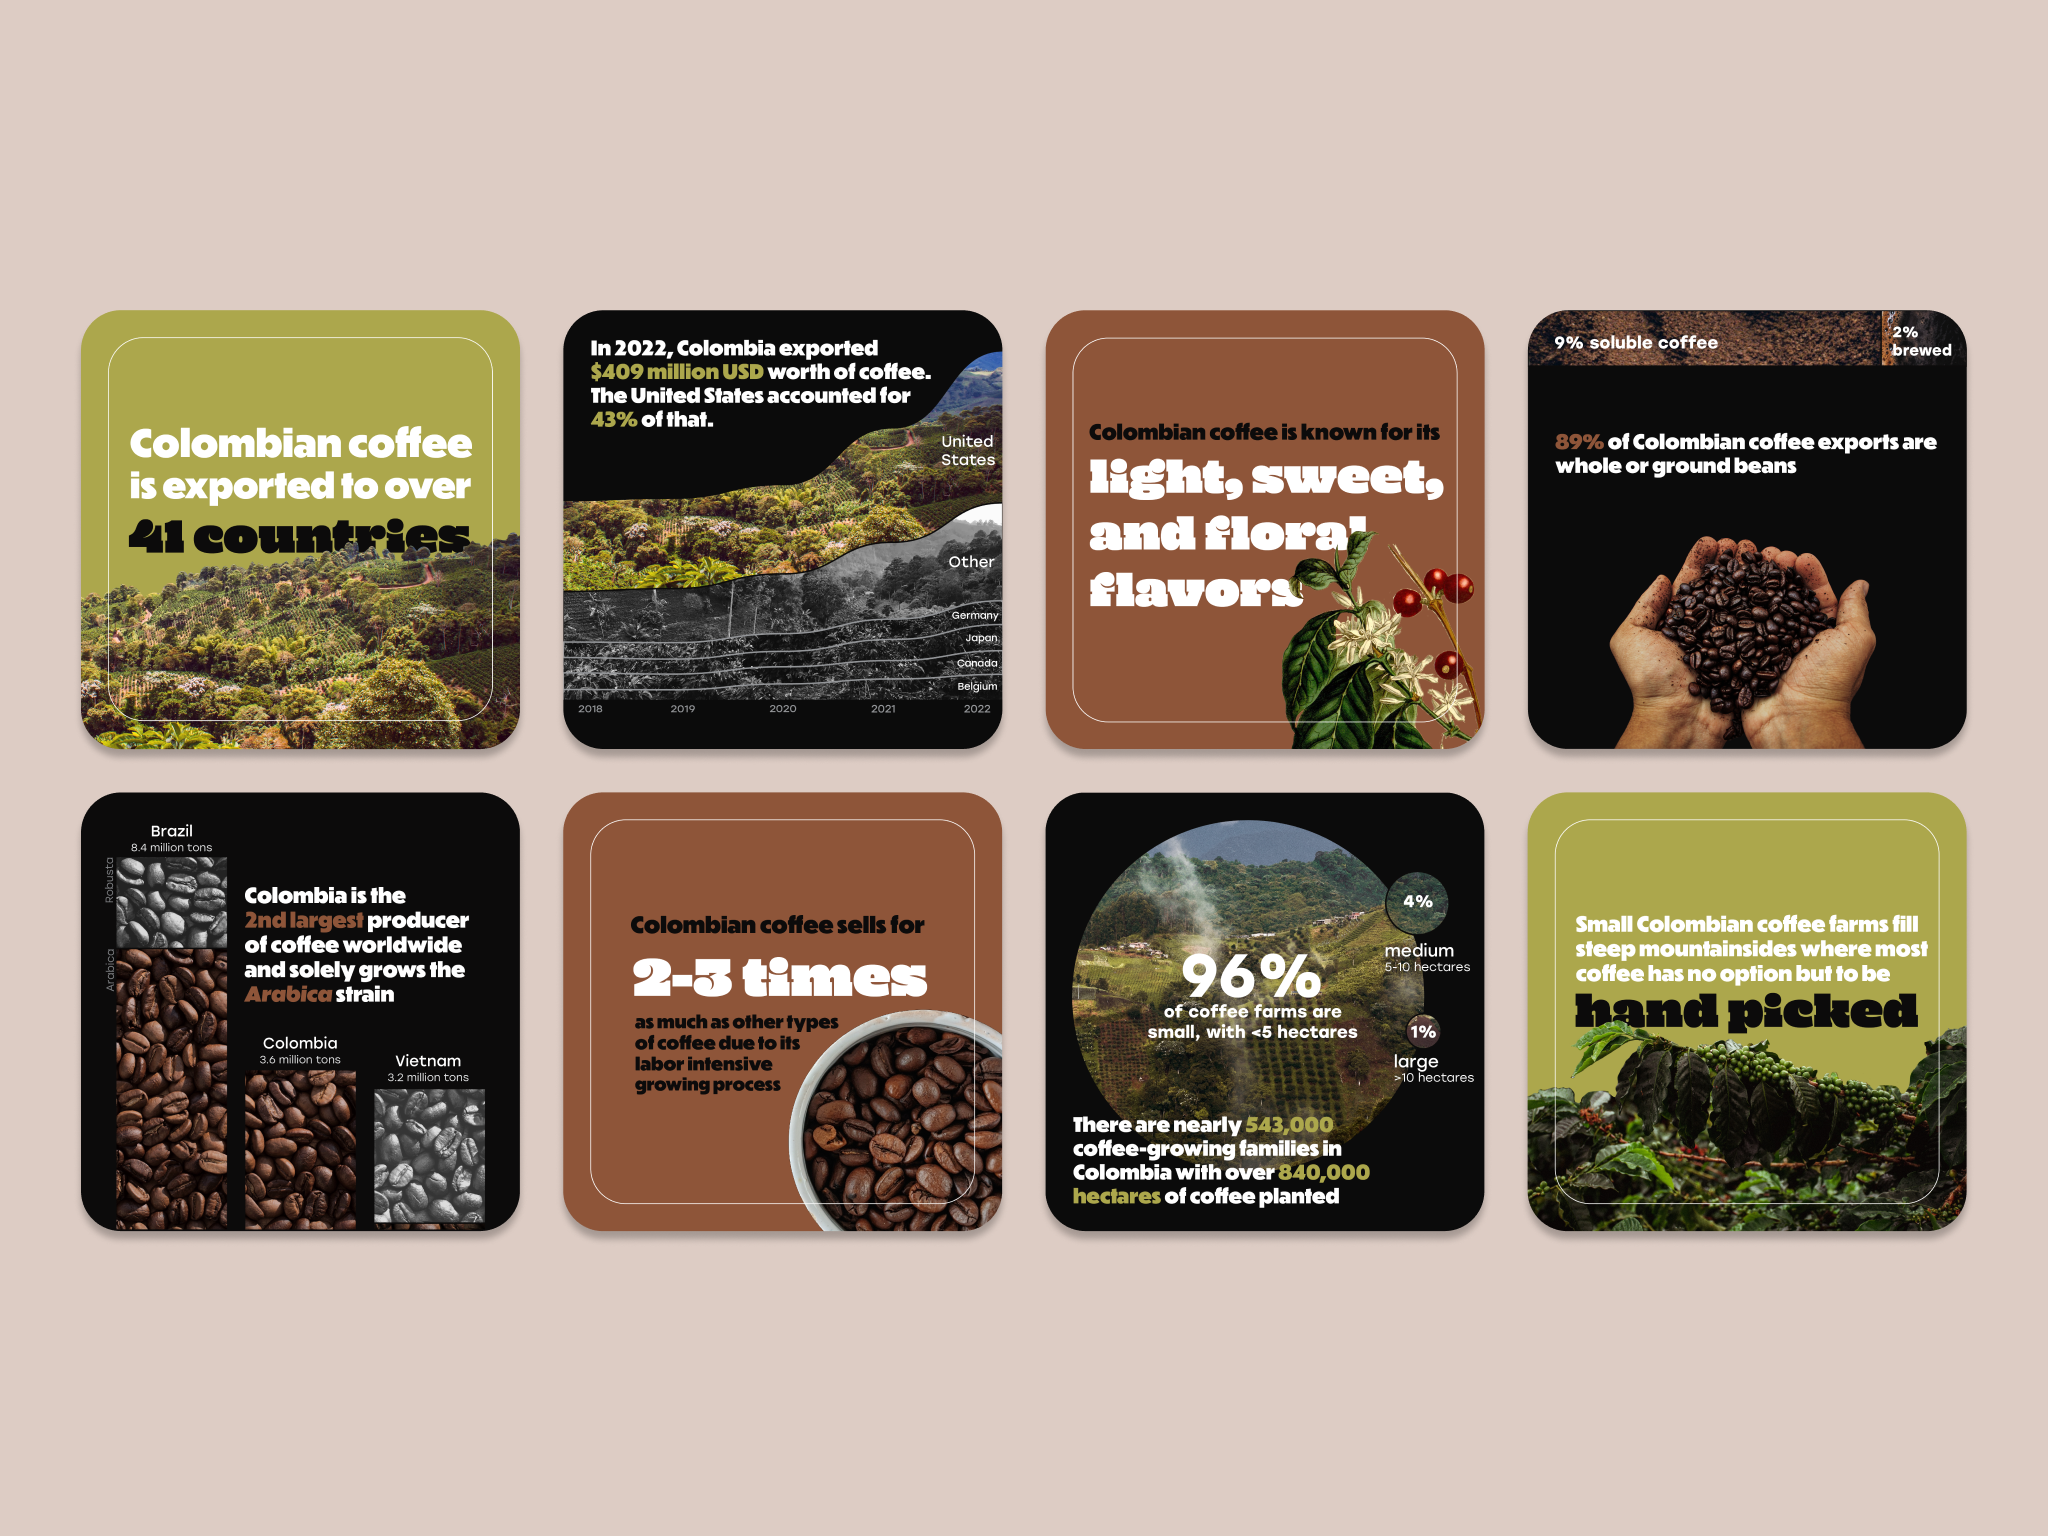
Coasters about the Colombian coffee trade
A set of coasters that use data and photographs to create collage-style illustrations about the Colombian coffee trade.

Threats to Critically Endangered Species
An article for a (hypothetical) scientific magazine about the largest threats to critically endangered animals.

Forest Growth in the last 30 years
Which countries are growing their forests at the highest rates?

Quantified Self: Books read in 2022
Every book I read in 2022 hand-drawn as flowers

DesignFest: Flyers for Caroline Center
Flyers to help non-profit Caroline Center tell compelling data stories to donors and Baltimore women
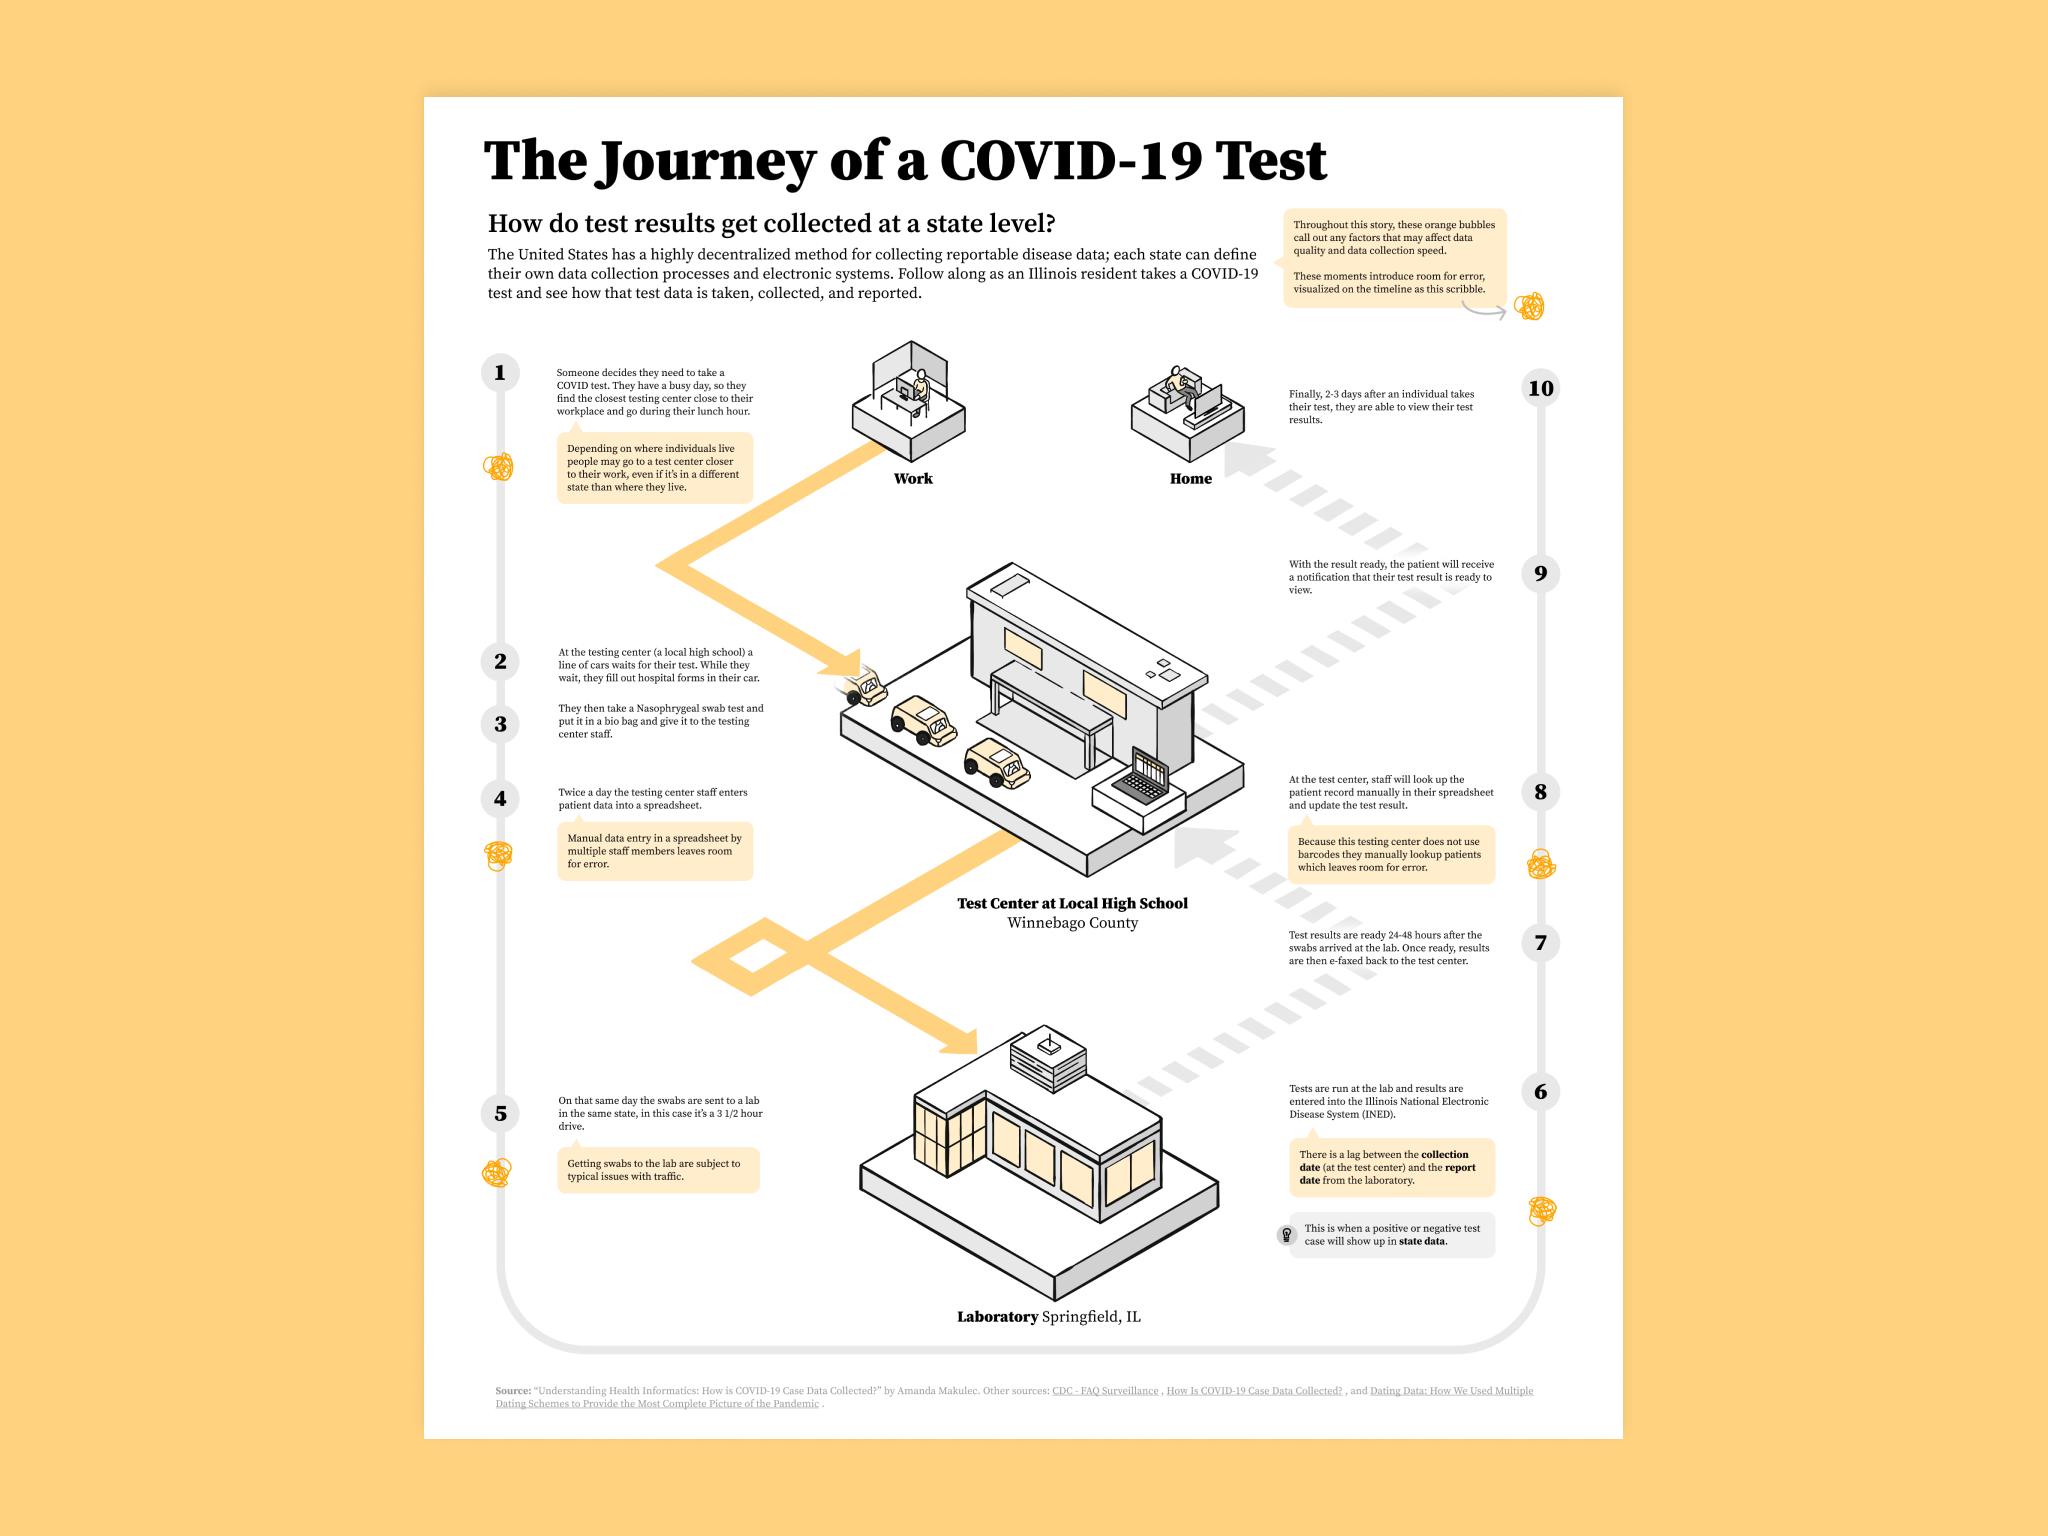
How a COVID test gets recorded at the State Level
A conceptual graphic that highlights the room for error in the data collection process for a COVID-19 Test at a state level
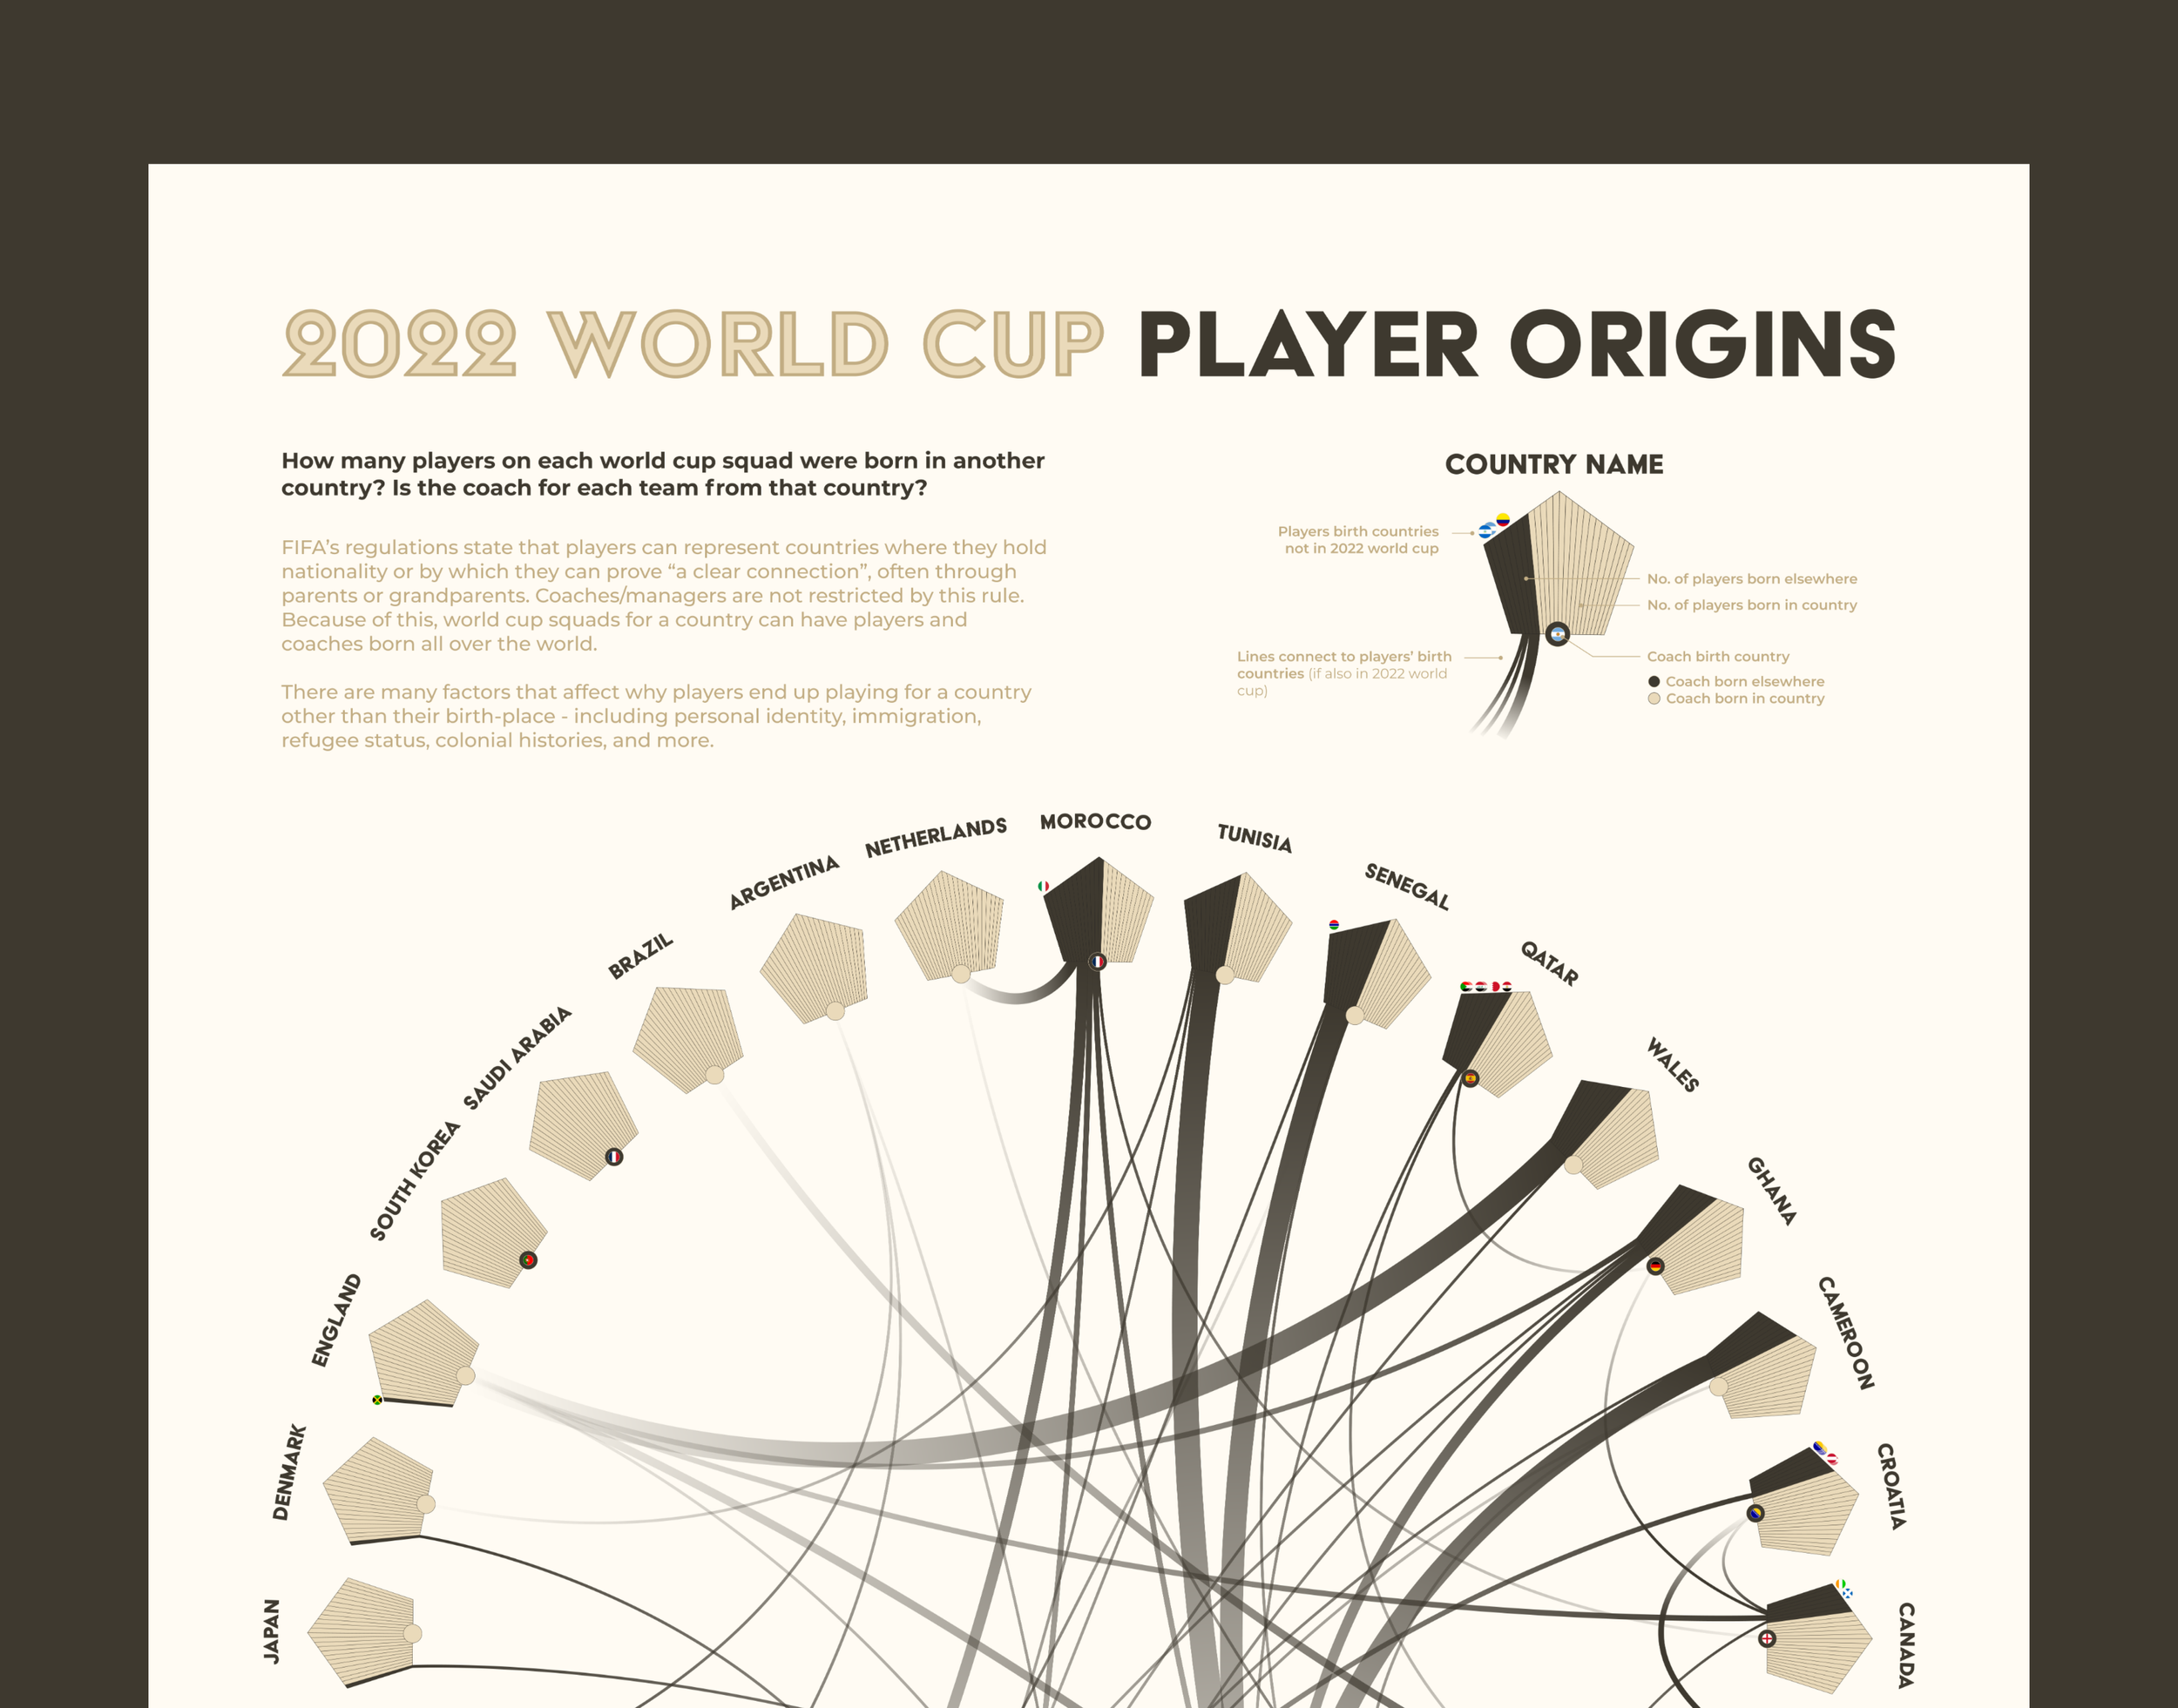
World Cup Player Origins
Not all World Cup players are born in the same country they play for. How global are World Cup players and coaches?